
A chromameter is a precision instrument utilized for measuring the color of objects or surfaces. It quantifies the hue, saturation, and brightness of an item by analyzing the wavelengths of light reflected or transmitted by it. This device finds applications in various industries such as paint, textile, cosmetics, and food, enabling accurate color assessment and quality control.

Highlights
- A chromameter is an instrument used to measure the color of an object or surface.
- Chromameters are commonly used in industries like paint, textiles, plastics, and food for precise color matching.
- A chromameter works by illuminating the object or surface with standardized light and measuring the amount of light reflected or transmitted at different wavelengths.
- The measurements obtained by the chromameter are used to calculate color values such as L*, a*, and b* in the CIELAB color space.
- The CIELAB color space is a three-dimensional coordinate system that represents the color attributes of lightness, red-green (a*), and yellow-blue (b*).
- To visualize the color samples, a color converter like the Nix color sensor can be used.
Food safety knowledge is for all!

Every consumer deserves to have high quality and safe food. …Read more!

What’s a chromameter?
A chromameter is an instrument used to measure the color of an object or surface. It measures the color by analyzing the amount of light reflected or transmitted by the object or surface at different wavelengths.
Chromameters are often used in industries such as paint, textiles, plastics, and food, where precise color matching is important. This article will help you to undertake colour measurement using the chromameter and visualize the colours.
How does a chromameter work?
A chromameter works by illuminating the object or surface with a standardized light source and measuring the amount of light reflected or transmitted at different wavelengths. The amount of light is measured using sensors that are sensitive to specific wavelengths of light. The chromameter then uses the measurements to calculate color values such as L*, a*, and b* in the CIELAB color space.
Food safety knowledge is for all!
Every consumer deserves to have high quality and safe food. …Read more!
The CIELAB color space
The CIELAB color space is a color model used to describe all perceivable colors. It was developed by the International Commission on Illumination (CIE) in 1976 as a successor to the CIE 1931 color space.
The CIELAB color space is based on a three-dimensional coordinate system that represents the color attributes of lightness, a* (red-green), and b* (yellow-blue). The Lab* values obtained from a chromameter or other color measurement instrument can be plotted in the CIELAB color space to represent a specific color.
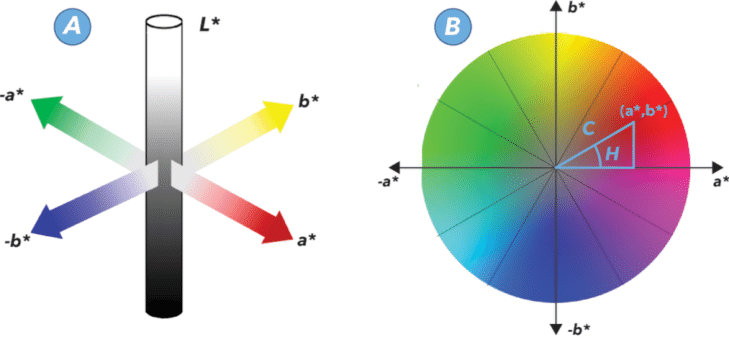
The L* value represents the lightness or darkness of the color and ranges from 0 (black) to 100 (white). The a* and b* values represent the color components of the measured object or surface. A positive a* value indicates a reddish color, while a negative a* value indicates a greenish color. A positive b* value indicates a yellowish color, while a negative b* value indicates a bluish color. A value of 0 for a* and b* indicates a neutral color.
Using a colour converter to visualize the colour
You can use a colour converter to better visualize the colour of the samples. There are many convertors available. Use the Nix colour sensor for this purpose.
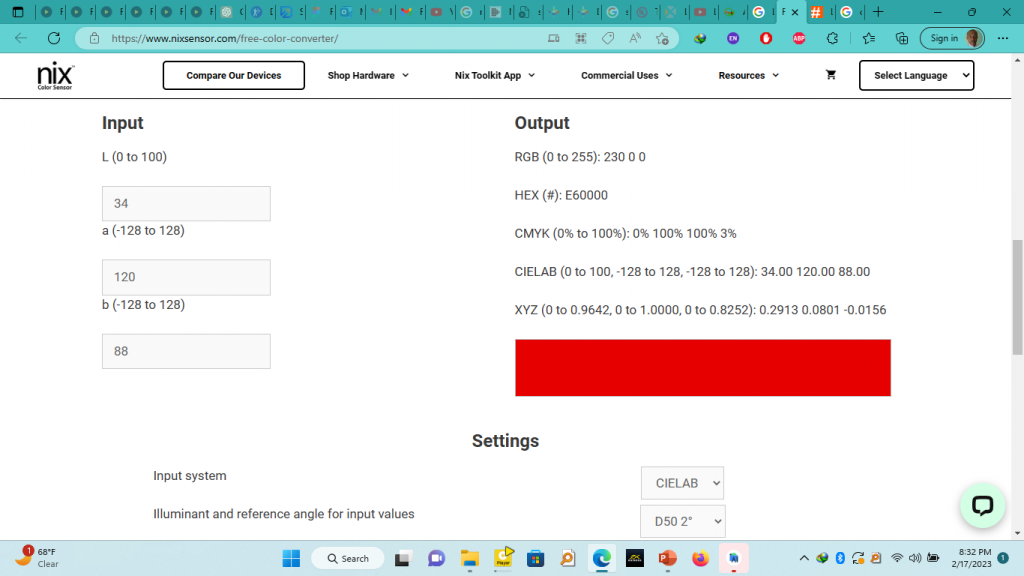
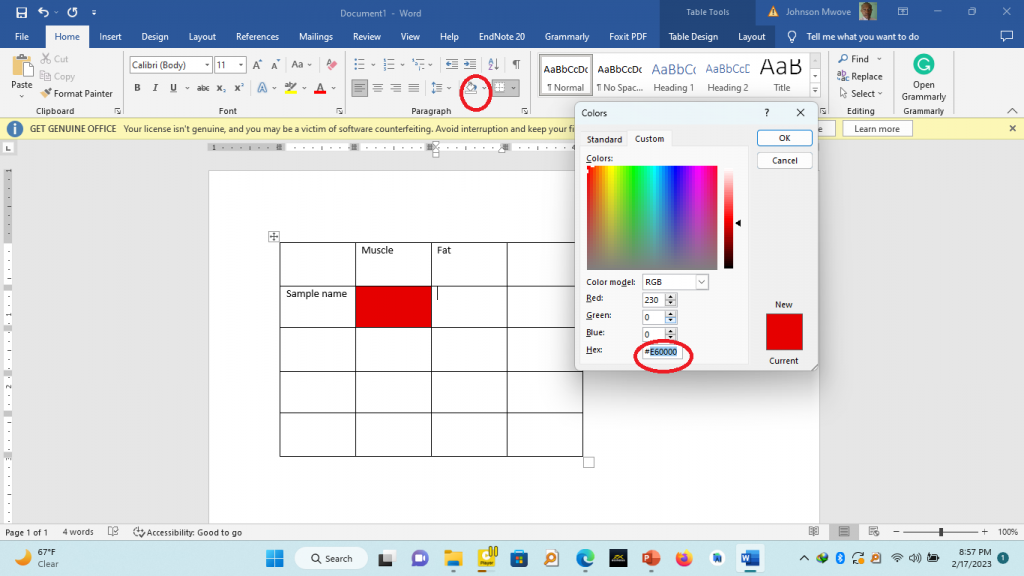
Enter the data obtained from the chromameter in a word document for visualization
Follow the followig steps:
- Open a word document and create a table.
- Enter the sample labels as required for all samples tested.
- Copy the HEX colour value for the specific colour of the sample obtained from Nix colour sensor – converter
- Fill the squares with the specific colour – paste the Hex colour code in the word custom colour picker.
- Print the final output-atatch to your report.
Our Blog ↗
Read the latest from our blog
Ask a Question ↗
Ask a question and get answers from our community
Give Feedback ↗
We value your feedback.
