Attempt the following questions to check your understanding of the subject:
PART 1
- Explain the following terms
- One factor at a time experimental design (2 Marks)
- Empirical and quantitative research (4 Marks)
- (a) A researcher noted that Chuka University students preferred street vended food than food sold from the licensed food businesses. Owing to the poor handling practices he had observed, he thought that this could be contributing to the student’s frequent visits to the university hospital. He therefore decided to study the effect of consuming street foods on the frequency of visits to the university hospital. Each student was asked whether or not they consumed street foods and the number of visits to the university hospital in the past 3 months. Identify which of the following statistical design features are included in this study (8 Marks)
(a) Factor(s)
(b) Factor levels
(c) Blocks
(d) Experimental units
(e) Repeat tests
(f) Replications
(g) Test runs
(h) Covariate(s)
- In question 2a above show the layout of the experiment and the statistical test(s) you would employ to analyze the data (4 Marks)
- Suppose some varieties of fish food (2 Foods) are to be investigated on some species of fishes (3 Species). The food is placed in the water tanks containing the fishes. The response is the increase in the weight of fish.
- Identify the experimental unit (2 Marks)
- What experimental design can be used (4 Marks)
- Show the layout of the study (2 Marks)
- What is the statistical model for this experiment? Explain all the terms (4 Marks)
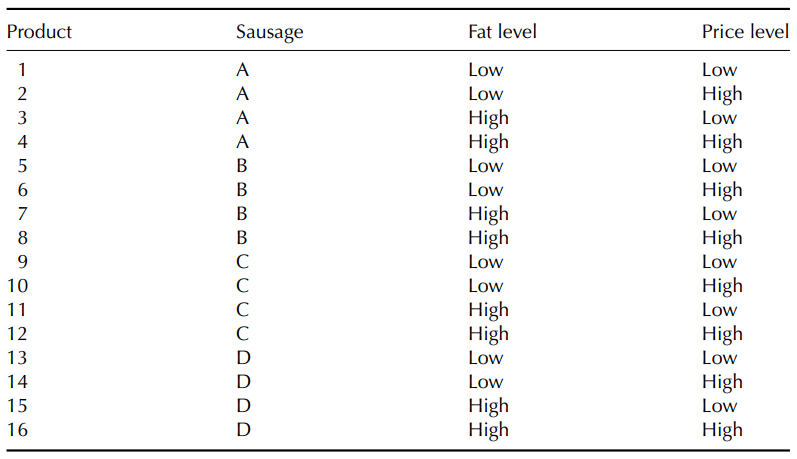
- The table below shows the variables that were considered in a certain experiment in which four types of sausages were prepared at two levels of fat (low and high) and sold at prices set at two levels (low and high). The researcher wanted to find out the effect of these factors on the demand for sausages indicated by the number of products sold over a duration of 1 week.
- Identify the statistical design that can be used to analyze the above data (4 Marks
- Show the statistical model for the above data (2 Marks)

PART 2
- The data below was obtained from an experiment designed to study the degree of liking (on a scale of 0-5) of five products with varied levels of fat content (30% (usual), 25%, 20%, 10% and 5%). The experiment was carried out in triplicate as shown
|
Level of fat |
1 |
2 |
3 |
|
30% (usual) |
5 |
4 |
4 |
|
25% |
4 |
5 |
5 |
|
20% |
3 |
4 |
5 |
|
10% |
4 |
5 |
6 |
|
5% |
2 |
4 |
3 |
Calculate
- the mean for each sample (3 Marks)
- The standard deviation for each sample (3 Marks)
- The coefficient of variation for each sample (3 Marks)
- Write the SAS program that will analyze the data above to obtain the above three statistics (4 Marks)
